

SHIFT TO EV MAKE AN E.mpact

EVs can reduce CO₂ emissions by up to 50% compared to conventional vehicles, significantly lowering toxic air pollutants.
Diesel vehicles contribute 40% of urban PM2.5 levels, which are absorbed by our lungs!
NOₓ reduction from EVs can lower ground-level ozone pollution, which affects 90% of urban populations worldwide.

Cleaner Future: Global EV adoption could reduce transport-related emissions by 1.5 Gt CO₂ annually by 2050.
Road transport accounts for 50% of NOₓ emissions in cities.
EV powered by renewable energy can reduce SO₂ emissions from fossil fuel combustion by up to 90%.

why cHANGE.
Highlighting UAE’s air pollutant elements and percentage changes(1995–2022).
NOₓ and CO surged until 2015, driven by fossil fuel reliance, while SO₂ spiked mid-2000s with fluctuating patterns.
BC rose sharply but declined, reflecting improved mitigation.
NH₃ exhibited steady growth due to agriculture, while NMVOCs plateaued post-2005.
These trends underscore the urgency of adopting EVs in supply chain and sustainable practices to combat escalating emissions.
China and Norway’s adoption of EVs for commercial and personal use has helped to drop CO levels by 50 and 80 percent respectively.
UAE being rich in non renewable resources and technologically advanced has much potential to adopt EVs in the supply chain.


purpose.
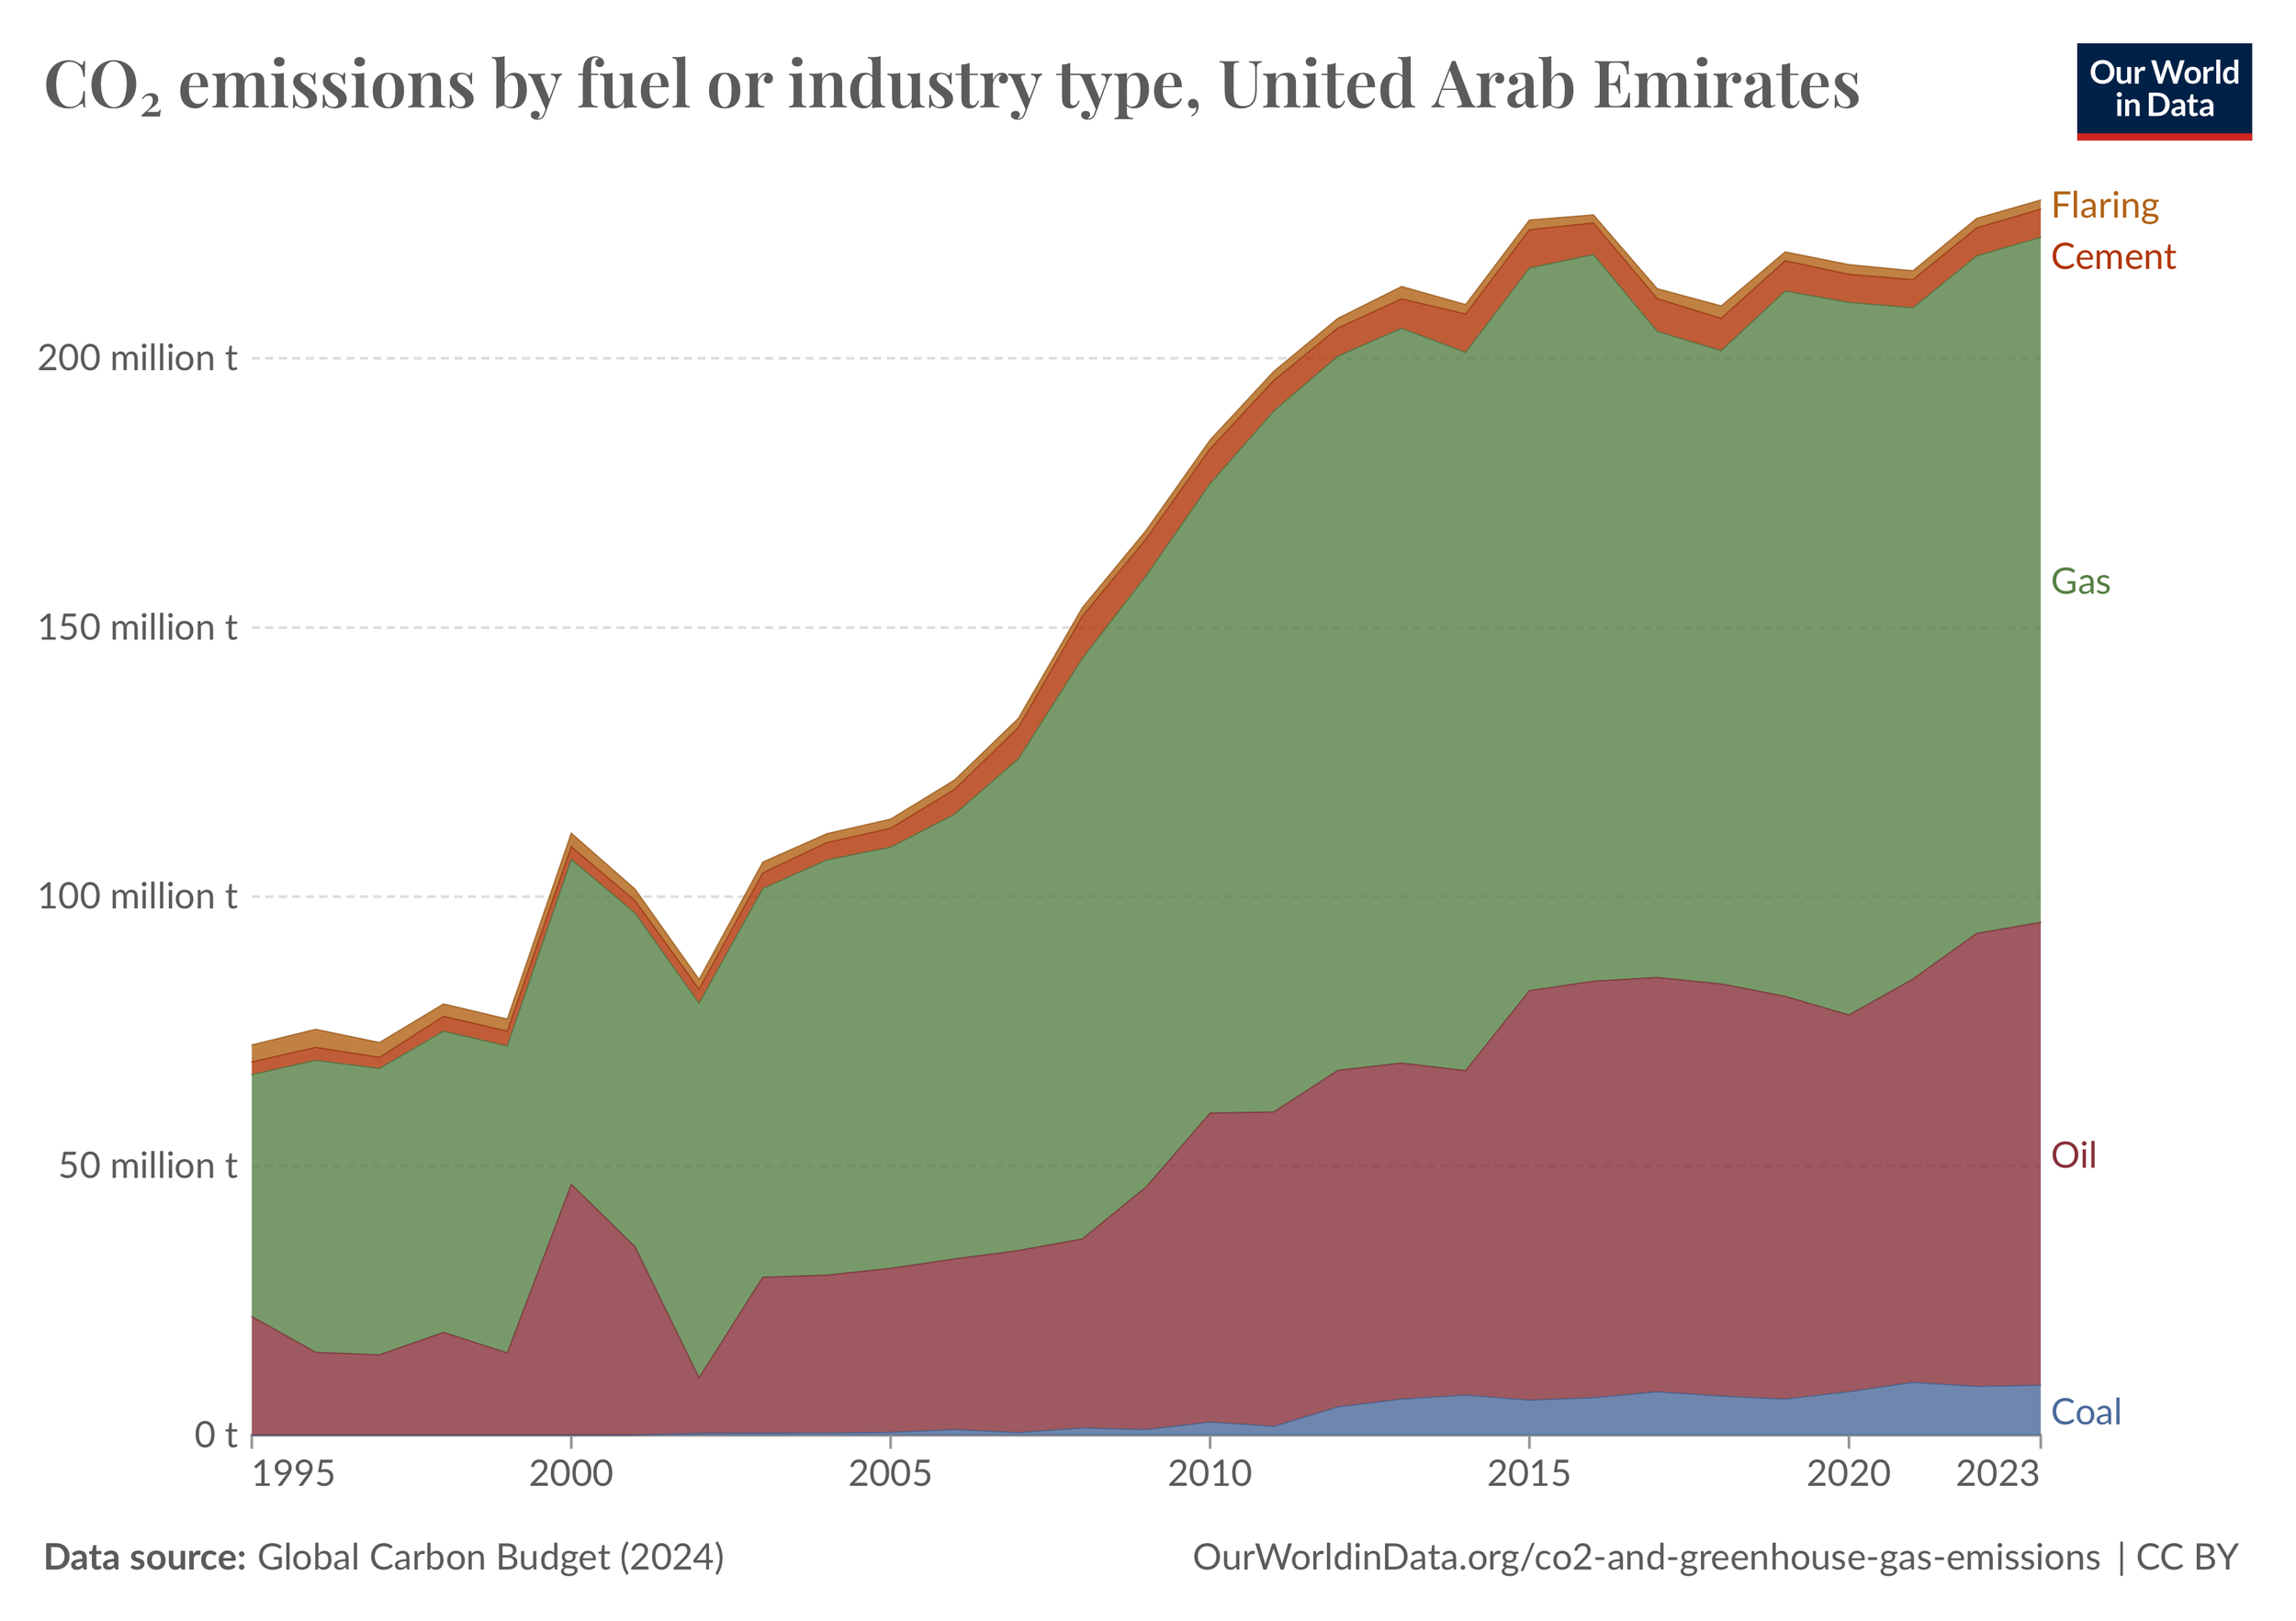
As displayed in the graph gas is the highest contributor for CO, CO2 and many such harmful gases leading to air pollution.
Our purpose at E. is to reverse the impact of CO and CO2 has on our economy by offering our EV fleet for your supply chain problems!
We are here to:
make an E.mpact!
make E.arth Healthy!
make E.nvironment Breathe!

SOME MORE COOL STUFF